With the Odin™ system & PMM you can: characterize metabolic pathways, validate genomic differences, and screen for phenotypic changes.

Introduction

Mammalian cell lines are critical tools for nearly every phase of development, from basic research and discovery of anti-cancer drugs to pre-clinical toxicity studies and manufacturing of biologics. The phenotypic and genotypic variety among commonly used cell lines are just as broad, including everything from immortalized cancer cell lines to freshly isolated donor cells. Given the expansive potential array of phenotypic characteristics and drug sensitivities, it becomes necessary to systematically characterize phenotypes in a high-throughput fashion. While some methods allow for screening of multiple phenotypes simultaneously, there are typically limitations in the number of phenotypes to be tested simultaneously, or cell-line specific challenges which prevent screening. Additionally metabolic profiling of mammalian cells is often accomplished by quantifying metabolite production rather than utilization via NMR, GC-MS, and HPLC-MS which usually require multi-step lysis, purification, and extraction, and require a high level of training to measure reliably. These limitations necessitate the use of a platform which is both flexible enough to accommodate diverse cell lines and provide a wide breadth of available conditions and substrates for assessment.

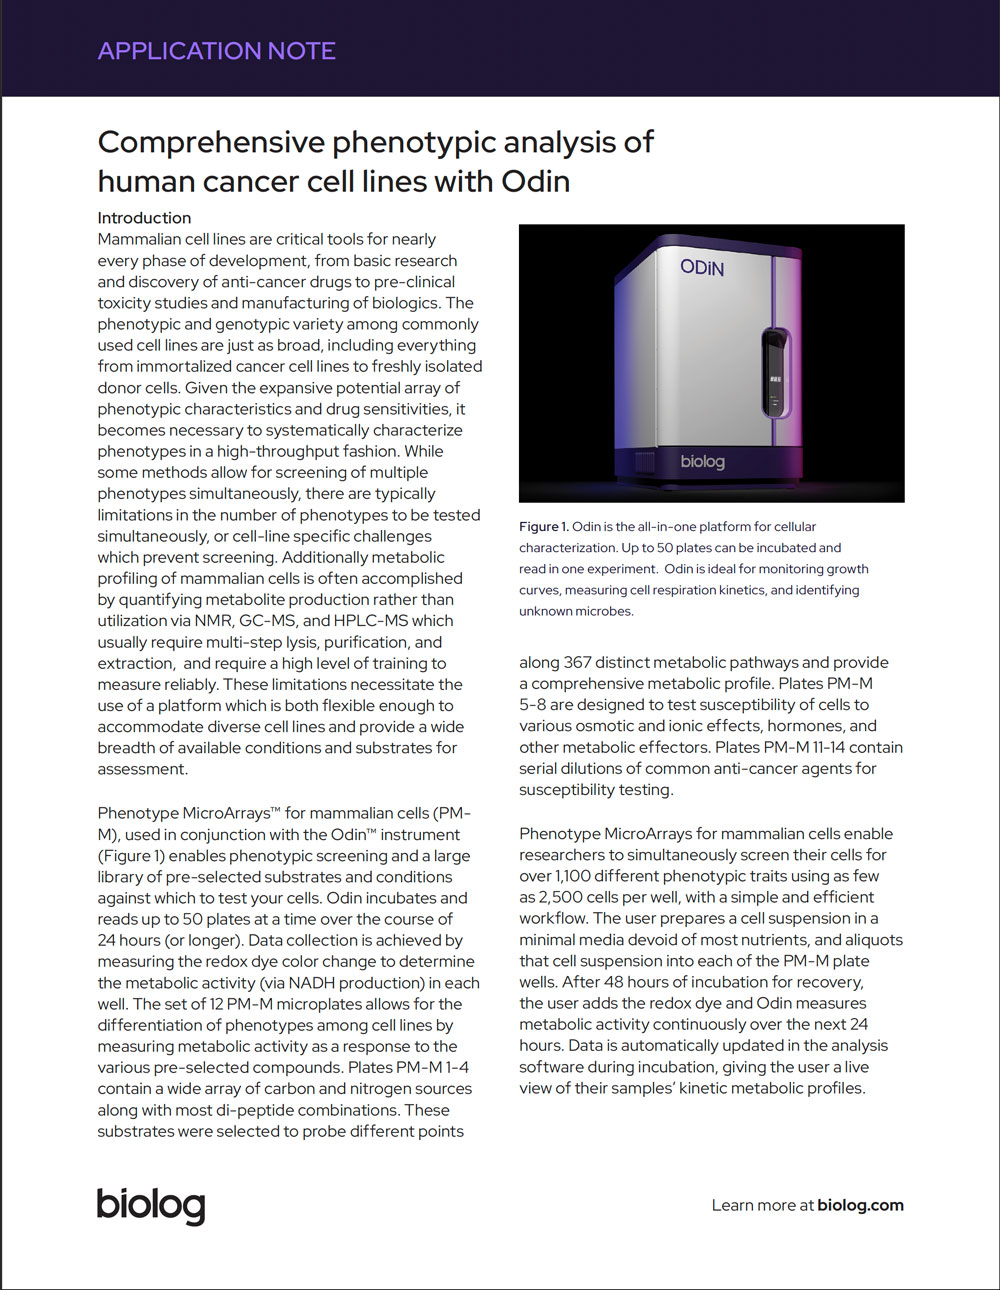
Figure 1. Odin is the all-in-one platform for cellular characterization. Up to 50 plates can be incubated and read in one experiment. Odin is ideal for monitoring growth curves, measuring cell respiration kinetics, and identifying unknown microbes.

Phenotype MicroArrays™ for mammalian cells (PMM), used in conjunction with the Odin instrument (Figure 1) enable phenotypic screening and a large library of pre-selected substrates and conditions against which to test your cells. Odin incubates and reads up to 50 plates at a time over the course of 24 hours (or longer). Data collection is achieved by measuring the redox dye color change to determine the metabolic activity (via NADH production) in each well. The set of 12 PM-M microplates allows for the differentiation of phenotypes among cell lines by measuring metabolic activity as a response to the various pre-selected compounds. Plates PM-M 1-4 contain a wide array of carbon and nitrogen sources along with most di-peptide combinations. These substrates were selected to probe different points along 367 distinct metabolic pathways and provide a comprehensive metabolic profile. Plates PM-M 5-8 are designed to test susceptibility of cells to various osmotic and ionic effects, hormones, and other metabolic effectors. Plates PM-M 11-14 contain serial dilutions of common anti-cancer agents for susceptibility testing.

Phenotype MicroArrays for mammalian cells enable researchers to simultaneously screen their cells for over 1,100 different phenotypic traits using as few as 2,500 cells per well, with a simple and efficient workflow. The user prepares a cell suspension in a minimal media devoid of most nutrients, and aliquots that cell suspension into each of the PM-M plate wells. After 48 hours of incubation for recovery, the user adds the redox dye and Odin measures metabolic activity continuously over the next 24 hours. Data is automatically updated in the analysis software during incubation, giving the user a live view of their samples’ kinetic metabolic profiles.

This application note shows how the Odin platform was used to compare two human cell lines: MCF-10A and COLO 205, and elucidate phenotypic differences between them which can point to divergent metabolic function as well as chemosensitivity. We demonstrate how phenotypic characteristics can be determined by identifying preferred metabolic substrates and susceptibility to stressors causing a shift in metabolic activity.

Methods

PM-M profiles for the COLO 205 and MCF-10A cell lines were generated using standard Biolog procedures for mammalian cells. Biolog IF-M1 was supplemented depending on the PM-M plate and cell line to create the complete MC-0 Assay Medium (Table 1). Cells were grown in RPMI with 10% fetal bovine serum using a 75 mL culture flask at 37 °C for 24 hours following which the spent media was aspirated and cells were washed twice with 10 mL D-PBS. Cells were then treated with 2 mL 0.25% trypsin with 1 mM EDTA for 2 minutes after which 3 mL MC-0 was added to “quench” trypsin. The cell suspension was transferred to a 15 mL conical tube and centrifuged at 350 x g for 10 minutes. The supernatant was then aspirated, and the cell pellet washed with 10 mL D-PBS, spun down as before. The D-PBS was aspirated, and cells resuspended in 10 mL pre-warmed MC-0 assay medium by pipetting up and down. Cell number and viability was assessed by removing 90 µL of the cell suspension and transferring to a sterile 1.5 mL microcentrifuge tube. 10 µL Trypan blue was added and 10 µL was then transferred to a hemocytometer to verify that >90% cells were viable. The cell suspension was diluted with additional MC-0 to final cell density (Table 1). 50 µL of the appropriate cell suspension was inoculated into each well of the PM-M plates and incubated at 37 °C with 95% air and 5% CO2 for 48 hours for recovery. 10 µL Dye mix MA was added to each well and the plates were transferred to the Odin instrument for incubation at 37 °C, and OD measurements were taken at 590 nm every 5 minutes for 24 hours.

Table 1: MC-0 Assay Medium component final concentrations and cell densities.

Results

The MCF-10A and COLO 205 cell lines were grown on PM-M 1-8 and 11-14 for 48 hours (MCF-10A) or 24 hours (COLO 205) to assess the functionality of more than 350 different metabolic pathways in addition to their reaction to ionic stress, hormones, metabolic effectors, and anti-cancer agents. This was accomplished by first inoculating 2,500-20,000 cells per well of each microplate. The plates were incubated for 48 hours for recovery before the addition of redox dye to determine metabolic output through an irreversible color change in response to NADH production. Plates were incubated in the Odin instrument following dye addition and read every 5 minutes for 24 hours. We were able to not only generate a phenotypic profile for both cell lines, but also identify shared and unique phenotypic traits for each.

Microplates PM-M 1-4 contain metabolic substrates including nearly 100 carbon sources as well as nitrogen sources like amino acids. Both MCF-10A and COLO 205 showed similar ability to utilize most of the carbon containing substrates. For example, both cell lines showed significant increase in metabolic output in the presence of α-D-glucose (well B5), D-mannose (well C5), and maltose (well A9) among others, which indicated that both cell lines were able to effectively use these substrates as the sole source of carbon (Figure 2). In contrast, MCF-10A was able to metabolize D-fructose (well D7) and D-turanose (well C12) whereas COLO 205 was not (Figure 2). These differences in metabolic activity may be indicative of alternate substrate preference as outlined by the commonly accepted Warburg Effect. COLO 205 cells are derived from a colon adenocarcinoma while MCF-10A cells are a model for normal breast tissue. Cancer cells have been shown in many cases to favor glycolytic energy production over oxidative phosphorylation. Therefore, the inability of COLO 205 cells to metabolize D-fructose as the sole carbon source could be attributed to this metabolic shift.

Microplates PM-M 5-8 contain ionic stressors, hormones, and metabolic effectors with glucose as the primary carbon source. Here we found that both cell lines responded similarly to most compounds. For example, in PM-M 5 both MCF-10A and COLO 205 were susceptible to increasing concentrations of potassium chloride (Table 2). PM-M 7 includes a six-step serial dilution of insulin at a range of concentrations (in addition to 10 µg/mL supplement added to the inoculating fluid). Interestingly, MCF10A showed high metabolic activity at all levels of insulin concentrations, whereas COLO 205 metabolism increased incrementally in line with increasing insulin levels (Table 2). This indicated that MCF-10A cells can undergo high levels of respiration independent of insulin levels whereas COLO 205 requires higher concentrations of insulin to instigate the same level of metabolic output. This sensitivity to insulin aligns with expectations as COLO 205, among other cancer cell types, have been found to demonstrate increased growth in response to insulin and insulin-like compounds (Baricevic 2015).

Both cell lines were also tested against a panel of 92 different anti-cancer agents in serial dilution using microplates PM-M 11-14. COLO 205 was inhibited by ancitabine hydrochloride while MCF-10A was able to respire consistently at most concentrations (Table 2). Berberine chloride appeared to be effective in inhibiting respiration of COLO 205 at all four concentrations where MCF-10A was only inhibited when exposed to the highest concentration of drug. Berberine chloride is a natural alkaloid which has recently been shown to have effectiveness in inhibiting metastasis and tumor growth through disruption of the cell cycle and modulation of the tumor microenvironment (Wang et al 2020). This was interesting as MCF-10A is used as a model for “normal” breast tissue, so susceptibility to high concentrations relative to the cancer cell line, COLO 205, emphasizes the importance of understanding the impacts of anti-cancer agents on non-cancerous cells.

Figure 2: PM-M 1 kinetic metabolic activity. X-axis indicates time 0-24 hours. Y-axis indicates OD590. COLO 205 (blue) and MCF-10A (green) showed varying degrees of respiration depending on the substrate present.

Table 2: Area Under the Curve values for MCF-10A and COLO 205 in response to inhibitors/effectors

Conclusion

Odin combined with Phenotypic MicroArrays for mammalian cells allows for the high throughput and reliable characterization of a wide variety of cell lines. Researchers can use this technology to generate a phenotypic profile of any cell line. The resulting profile can then be used to learn more about the cell line, its ability to utilize various energy sources, and its sensitivities to a range of inhibitors. It can also be used to compare with profiles of other cell lines, to validate phenotypic characteristics of potentially contaminated cells, or understand if the cell line has undergone phenotypic drift at higher passage levels. The use of a tetrazolium-based dye instead of a cellspecific marker or extraction of genetic material for sequencing enables the profiling of mammalian cells with relatively little training and investment. Here we used metabolic output as a metric to find preferred nutritional substrates and sensitivity profiles of MCF-10A and COLO 205, and showed that the two cell lines displayed both similar and unique aspects to their metabolic preferences and susceptibility to inhibitors.

References

Ivona Baricevic et. al., A framework for the in vitro evaluation of cancer-relevant molecular characteristics and mitogenic potency of insulin analogues, Carcinogenesis, Volume 36, Issue 9, September 2015, Pages 1040–1050, https://doi.org/10.1093/carcin/bgv071

Wang Y, Liu Y, Du X, Ma H, Yao J. The Anti-Cancer Mechanisms of Berberine: A Review. Cancer Manag Res. 2020 Jan 30;12:695-702. doi: 10.2147/CMAR.S242329. PMID: 32099466; PMCID: PMC6996556.